Recently I had to do some debugging of a WCF service. I used trace logs for this, but the output format of the tracelogs is a wall-of-text xml file. Luckily, Microsoft has created a viewer that facilitates working with these tracelog xml files, "ServiceTraceViewer".
The viewer has three panes:
- Activity pane (left) — groups related operations by activity ID
- Trace pane (upper right) — individual trace events for the selected activity
- Trace Detail pane (lower right) — full XML of the selected trace, including message bodies
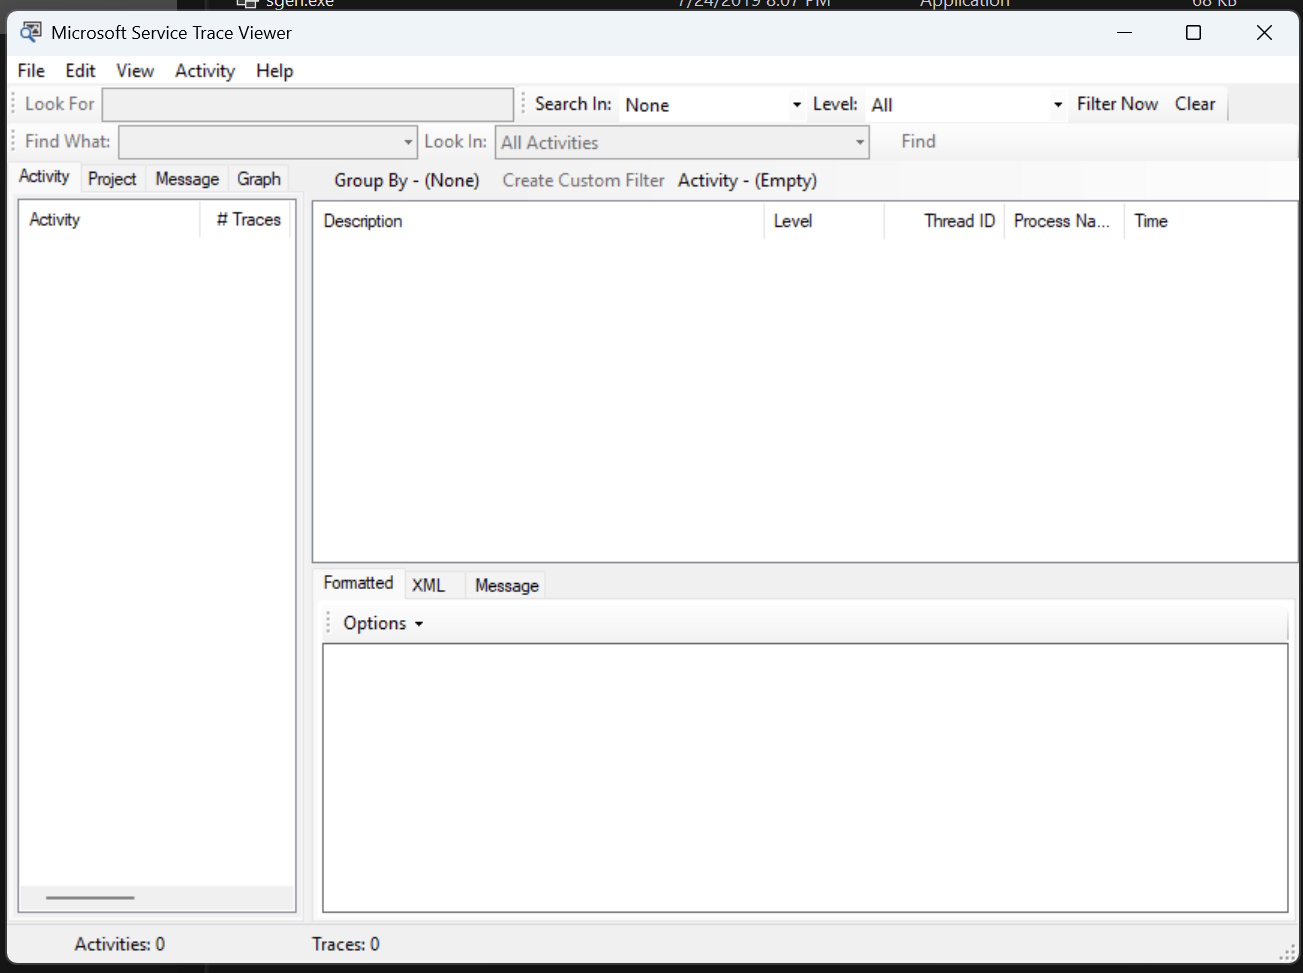
The viewer is installed along with the Windows SDK, and can typically be found at:
C:\Program Files (x86)\Microsoft SDKs\Windows\v10.0A\bin\NETFX 4.8 Tools\SvcTraceViewer.exe
To enable tracing, add a <system.diagnostics> section to web.config. The snippet below configures two listeners: a TextWriterTraceListener writing a plain-text .log file and an XmlWriterTraceListener writing a .svclog file. Only the .svclog can be opened in ServiceTraceViewer — make sure you are opening the right one.
<configuration>
  <system.diagnostics>
    <trace autoflush="true">
      <listeners>
        <add name="wcf_listener"
             type="System.Diagnostics.TextWriterTraceListener"
             initializeData="C:\logs\myservice.log" />
        <remove name="Default" />
      </listeners>
    </trace>

    <sources>
      <source name="System.ServiceModel"
              switchValue="Information, ActivityTracing"
              propagateActivity="true">
        <listeners>
          <add name="wcf_listener" />
          <remove name="Default" />
        </listeners>
      </source>
    </sources>

    <sharedListeners>
      <add name="wcf_listener"
           type="System.Diagnostics.XmlWriterTraceListener"
           initializeData="C:\logs\myservice.svclog">
      </add>
    </sharedListeners>
  </system.diagnostics>
</configuration>
switchValue options:
| Value | What it captures |
|---|---|
| Off | Nothing |
| Critical | Fatal errors only |
| Error | Errors |
| Warning | Warnings and above |
| Information | General flow and errors |
| Verbose | Everything, including message bodies |
| ActivityTracing | Activity correlation events — required for the Activity pane to be useful |
Verbose, ActivityTracing produces very large files quickly. Information, ActivityTracing is a good default for most debugging scenarios.
Note: WCF trace logging can produce hundreds of MB per hour under load and noticeably slows the service. Remove or comment out the <system.diagnostics> block when you are done debugging.