August 6, 2016
Gantt Chart
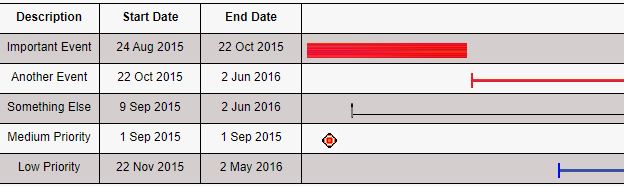
I’ve posted a JavaScript version of my simple Gantt chart.
It’s not a full-featured Gantt chart like you might find in Microsoft Project. The intent is for it to be something like a calendar — to provide a visual representation of a series of events where overlaps are easy to spot. I’ve tried to make it easy to embed this chart in another page or application.
I’d welcome any suggestions or comments regarding this version of the Gantt chart.
Update: There is now a live Gantt Chart Generator — type in your tasks and dates and get a ready-to-embed HTML snippet back, no coding required.